
Dogan Kutukcu/E+ via Getty Images
Dogan Kutukcu/E+ via Getty Images
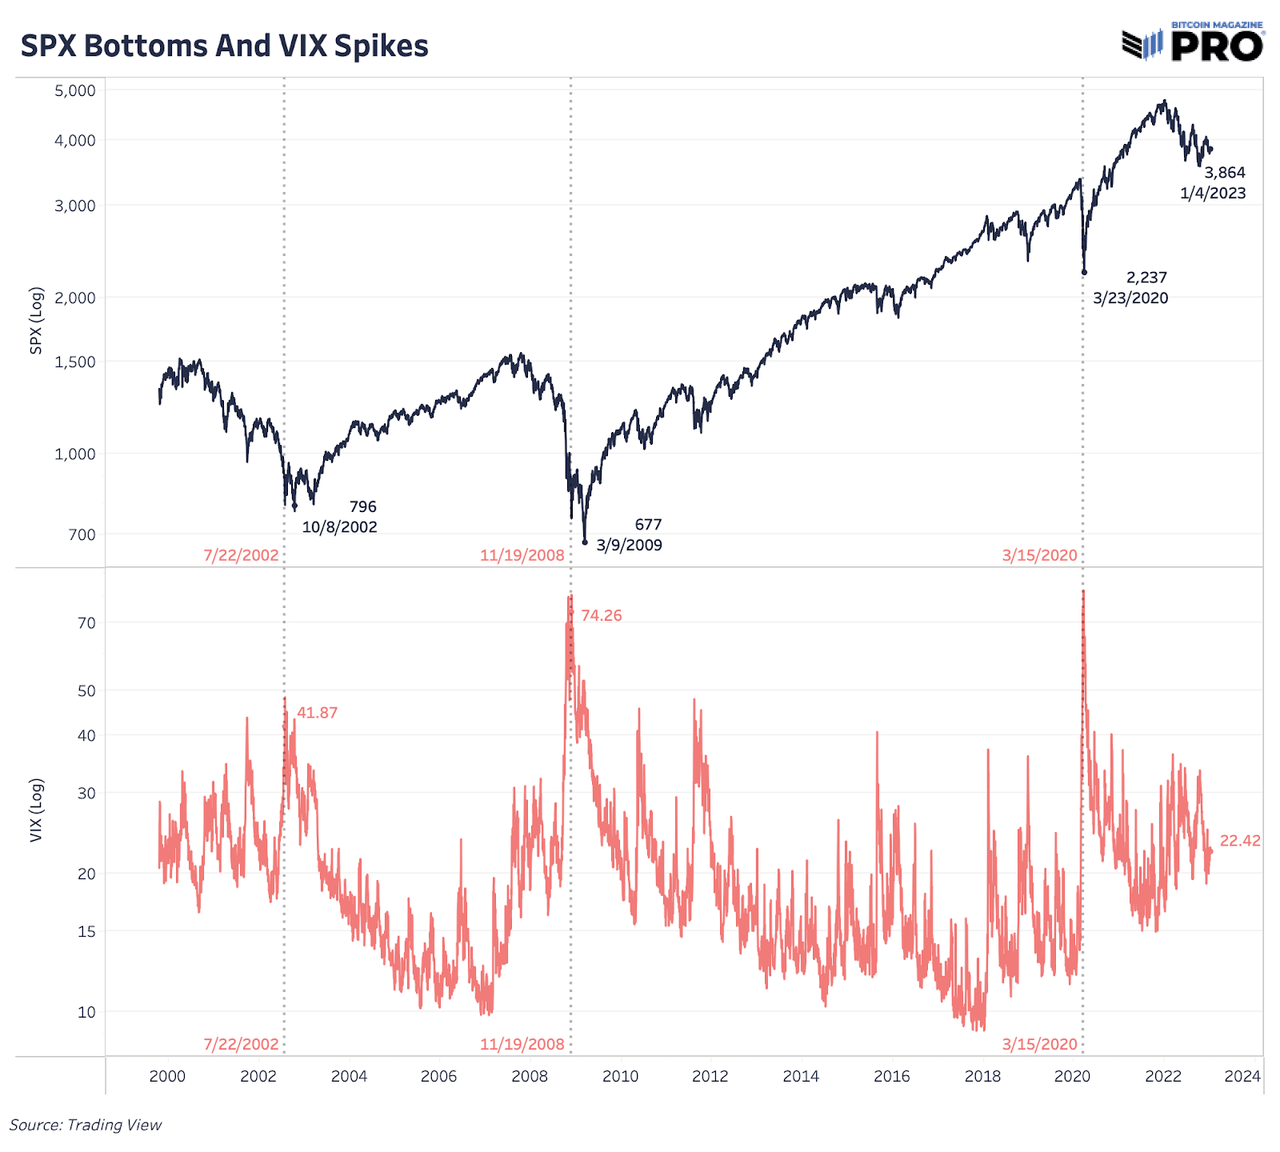
As we head into 2023, we want to highlight the latest state of Bitcoin’s (BTC-USD) volume and volatility after a recent wave of capitulation. Last time we touched on these dynamics was in “The Bitcoin Ghost Town” in October, where we highlighted that an extremely low volume and low volatility period in Bitcoin price, Grayscale Bitcoin Trust (OTC:GBTC) and the options market was a concerning sign for the next leg lower. This played out in early November.
Fast forward and the trends of declining volume and low volatility are back once again. Although this could be indicative of another leg lower to come in the market, it’s more likely indicative of a complacent and decimated market that few participants want to touch.
Even during the November 2022 capitulation period, there was a historically low period of volatility. Sometimes the most market pain can be felt when having to wait for a clear change in trends. The Bitcoin price is providing that pain as we’ve yet to see the type of explosion in market volatility that has defined market pivots and major directional moves in the past.
Bitcoin Magazine PRO
Bitcoin Magazine PRO
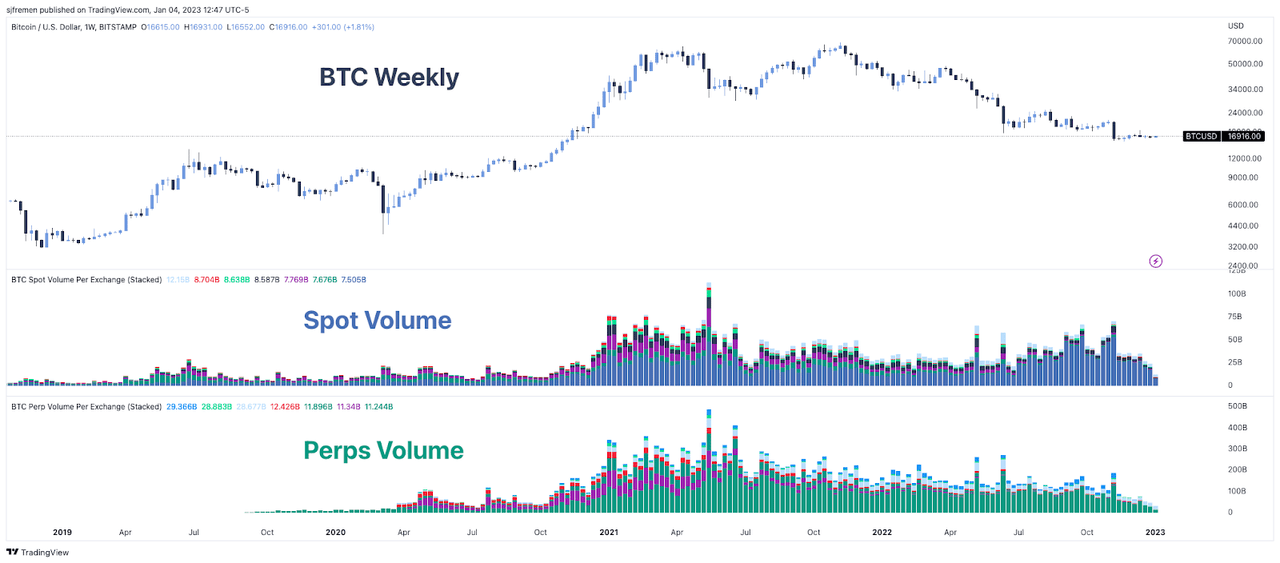
While there are many different ways to define, classify and estimate Bitcoin volume in the market, they all show the same thing: September and November 2021 were the peak months of action. Since then, volume in both the spot and perpetual futures markets have been in steady decline.
sjfremen
sjfremen
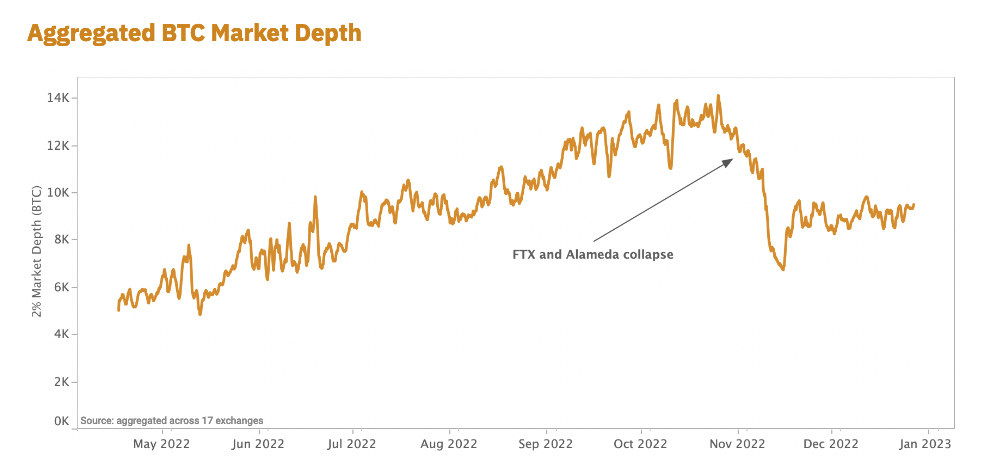
Overall market depth and liquidity has also taken a major hit after the collapse of FTX (FTT-USD) and Alameda. Their destruction has led to a large liquidity hole, which is yet to be filled due to the lack of market makers currently in the space.
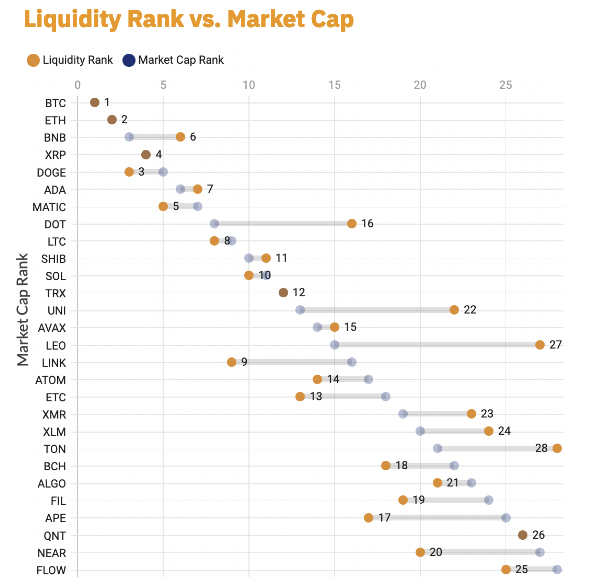
By far, Bitcoin is still the most liquid market of any other cryptocurrency or “token,” but it’s still relatively illiquid compared to other capital markets since the whole industry has been crushed over the last few months. Lower market depth and liquidity means assets are prone to more volatile shocks as single, relatively large orders can have a greater impact on market price.
Kaiko Q4 Report
Kaiko Q4 Report
Kaiko Q4 Report
Kaiko Q4 Report
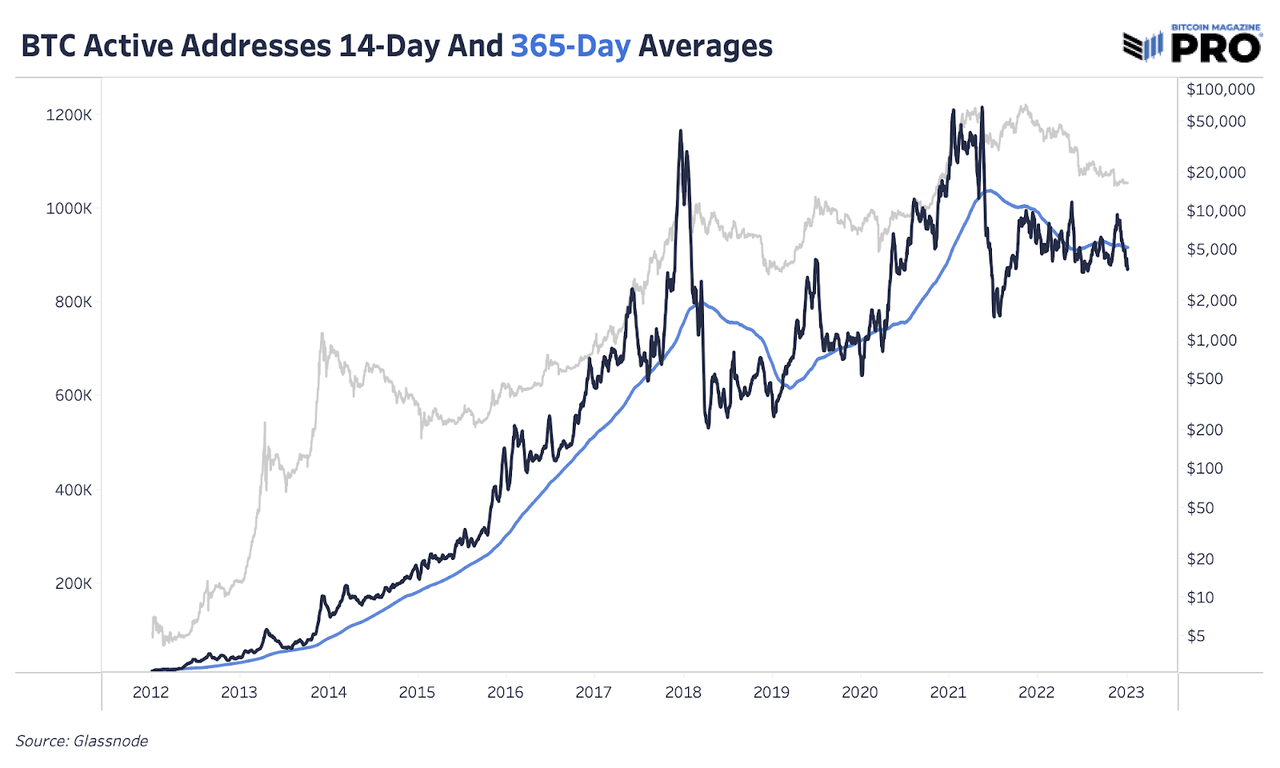
As expected in the current environment, we’re also seeing more market complacency when looking at on-chain data. Although continuing to rise over time, the number of active addresses — unique addresses active as either a sender or receiver — remain fairly stagnant over the last few months. The chart below highlights the 14-day moving average of active addresses falling below the running average over the last year. In previous bull market conditions, we’ve seen growth in active addresses outpace the existing trend fairly significantly.
Bitcoin Magazine PRO
Bitcoin Magazine PRO
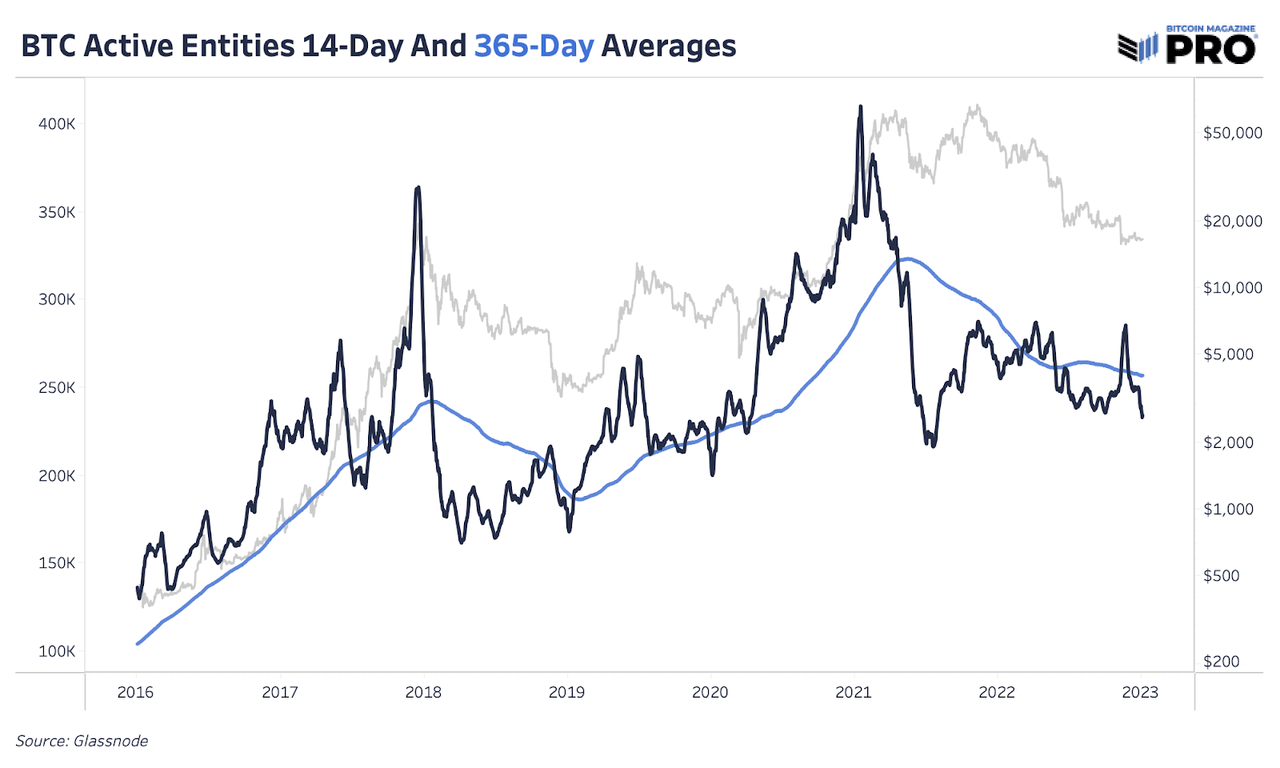
Since address data has its flaws, looking at Glassnode’s data for active entities shows us the same trend. Overall, bear markets reversing are the result of many factors, including growth in new users and an increase in on-chain activity.
Bitcoin Magazine PRO
Bitcoin Magazine PRO
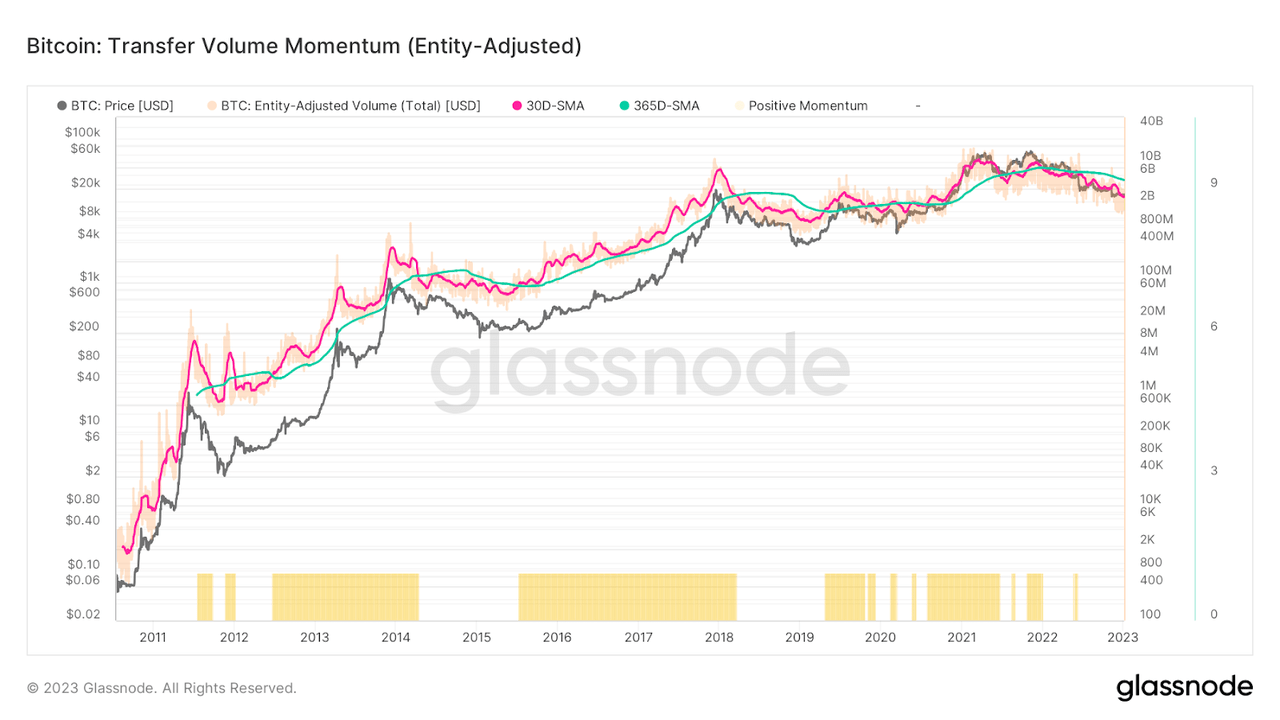
We can look at the moving averages of transfer volume across various time periods to see whether on-chain activity and momentum is increasing or decreasing relative to the trend. In past bear market cycles, on-chain activity begins to pick up relative to trend before the exchange rate recovery cycle is in full effect.
Glassnode
Glassnode
Today’s trend shows a diminishing level of on-chain transactional activity when comparing the 30-day and 365-day moving averages. While this is not to say that there is a certainty of lower prices and worsening conditions for the asset, it is saying that a meaningful change in trend has yet to occur.
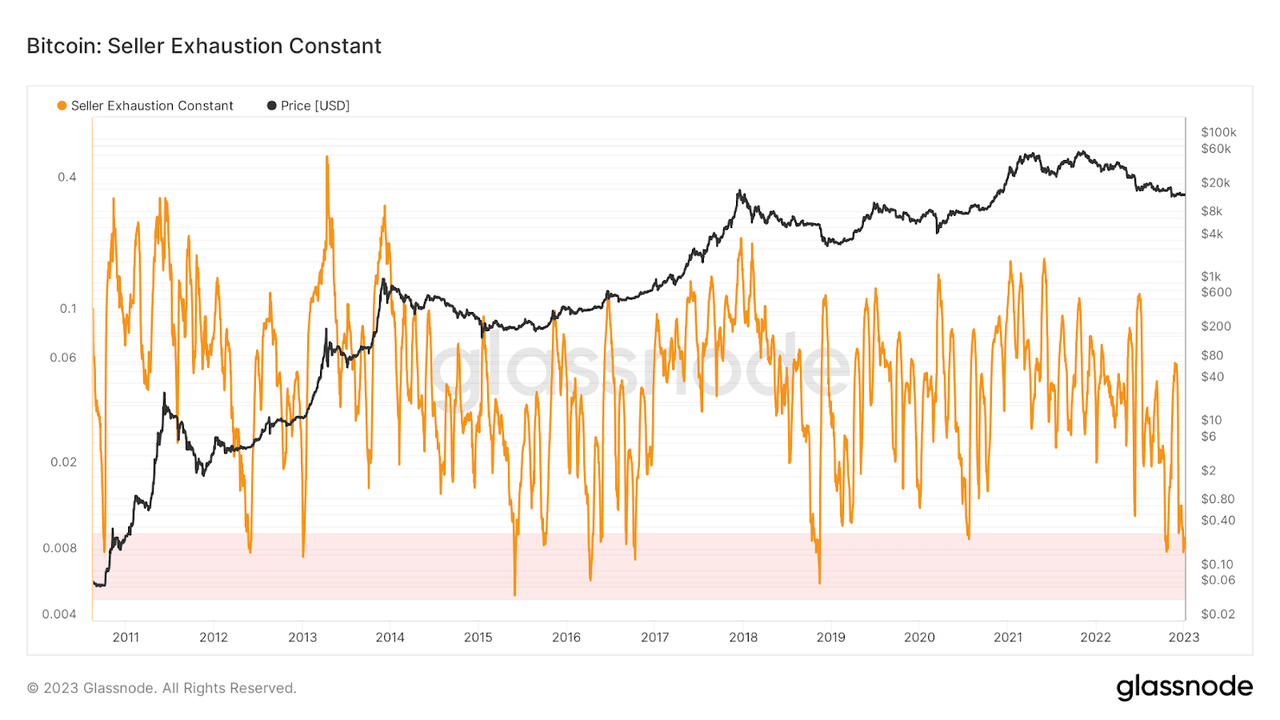
Lastly, we can look at the seller exhaustion constant metric, which takes the percentage of the Bitcoin supply in profit and multiplies it by the 30-day realized volatility. The metric’s name states its intention perfectly: an attempt to quantify when sellers may be exhausted, given low levels of profitability and historically low levels of volatility in tandem.
Glassnode
Glassnode
In our July 11 release “When Will The Bear Market End?”, we made the case that the brunt of the price-based capitulation had already been felt, while the real pain ahead was in the form of a time-based capitulation.
“A look at previous Bitcoin bear market cycles shows two distinct phases of capitulation:
“The first is a price-based capitulation, through a series of sharp selloffs and liquidations, as the asset draws down anywhere from 70 to 90% below previous all-time-high levels.
“The second phase, and the one that is spoken of far less often, is the time-based capitulation, where the market finally begins to find an equilibrium of supply and demand in a deep trough.”
We believe time-based capitulation is where we stand today. While exchange rate pressures can certainly intensify over the short term — given the macroeconomic headwinds that remain — the conditions that look likely to persist over the short and medium term look to be a sustained period of chop with extremely low levels of volatility that leave both traders and HODLers questioning when volatility and exchange rate appreciation will return.
Market chop may be expected in the coming months, but this period of time-based capitulation has historically been a rare buying period for those with strong conviction in the long-term value proposition of Bitcoin.
Editor’s Note: This article discusses one or more securities that do not trade on a major U.S. exchange. Please be aware of the risks associated with these stocks.
This article was written by
Disclosure: I/we have a beneficial long position in the shares of BTC-USD either through stock ownership, options, or other derivatives. I wrote this article myself, and it expresses my own opinions. I am not receiving compensation for it. I have no business relationship with any company whose stock is mentioned in this article.